Dynamic Light Scattering
Dynamic light scattering for proteins and other biologics
Equipping biologics researchers with dynamic light scattering instruments designed for biologics
Dynamic light scattering (DLS) is a technique used to determine particle size and size distribution by measuring the rapid changes in light scattering by these molecules or particles in solution. Due to Brownian motion, these particles move in solution and this causes fluctuations in scattering intensity over time. The larger the particle, the slower the movement and hence slower the fluctuation. DLS analysis is a quick, label-free, and non-destructive way to understand size for many biologics – peptides, proteins, viruses, nanoparticles, or VLPs. For getting a read on the average size and aggregation state of a sample of 10 nm antibody, 30 nm AAV or any sub-micrometer protein, DLS is the best option for biologics researchers. Rotating angle dynamic light scattering (RADLS) is an even more powerful technique applicable to larger particles and it builds on the fundamentals of dynamic light scattering by gathering data from multiple angles.
Unchained Labs has the ultimate kick-ass DLS instruments for solving sizing problems – Stunner and Aunty. Both use low sample volumes and each instrument adds a little something extra: want a quick read on concentration in addition to size? Only Stunner can do it. Looking to get the whole picture of a sample’s stability, for example in a thermal ramp? Aunty is your one-stop platform.
How does dynamic light scattering work?
Shine a laser on a solution of particles and you’ll get plenty of light scattered back out at you. When the laser wavelength is much larger than the size of the particles, you get equal amounts of light scattered in every direction (the scattering is isotropic) – that’s why we use a 660 nm laser in our DLS instruments.
DLS can tell you a lot about the size of the particles in solution by monitoring how rapidly that scattered light intensity changes over time (Figure 1). Since Brownian motion makes small particles zip around more quickly, the intensity of scattered light changes quickly. In contrast, larger ones are slower to move and the fluctuations are on a longer time scale. Analyzing whether light intensity is changing fast or slowly – that’s the secret sauce of DLS analysis.
Here’s how to think about analyzing light scattering data for DLS: pick a point in time – now jump forward a microsecond. Odds are good most particles haven’t moved around yet – so the light scattering picked up by our detector hasn’t changed and the data from time zero and a microsecond later are about the same. In other words, they are highly correlated.
Now instead of a microsecond, jump forward a full second. Most particles will be in totally different spots – and you now have zero correlation in the data between your starting point and your jump to one second later. Graph these correlation values for a range of jumps of different durations and you get a correlation function (Figure 2). How quickly particles go from high correlation to zero correlation (the point of half decay of the correlation function) tells you their average size. This is also why dynamic light scattering is sometimes called photon correlation spectroscopy (PCS).
Interpreting DLS Results to get to hydrodynamic diameter and to spot aggregation
To get from a correlation function to the stuff you really care about – size data – two analysis methods are used. The first method (cumulant analysis) fits a single exponential decay to the correlation function and this results in a z-average diffusion coefficient Dt and a polydispersity index value (PDI; to assess heterogeneity of the sample). The connection of diffusion coefficient to z-average particle diameter is expressed in the Stokes-Einstein equation.

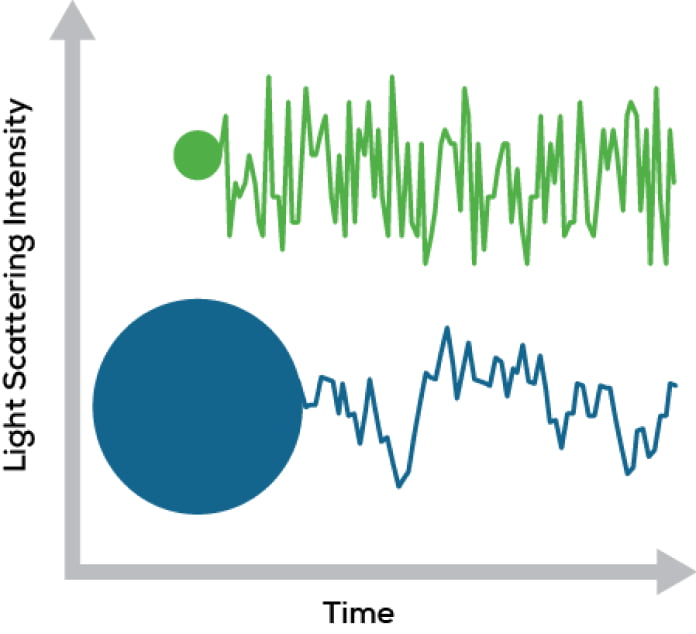
Figure 1. Light scattering intensity changes differently over time for different sized particles.
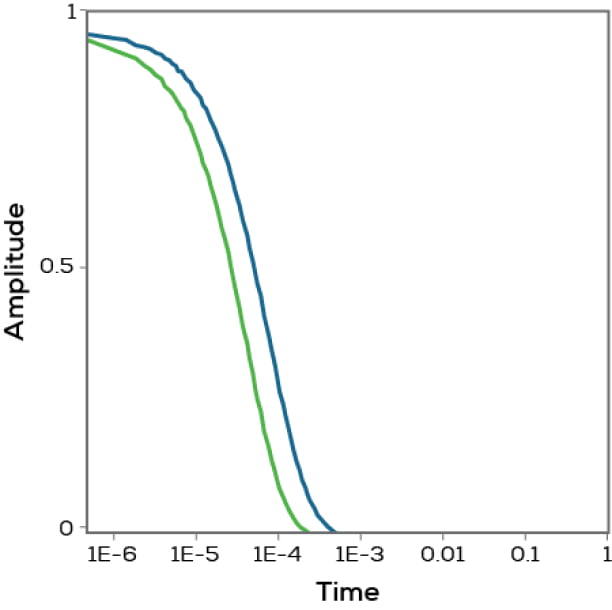
Figure 2. Correlation functions for proteins of two different sizes.
To complete the other variables in this equation, sample temperature T is measured and solvent viscosity η is user-defined. The diameter calculated is the hydrodynamic diameter. The correlation function also allows the determination of the uniformity or homogeneity of the sample, quantified by the polydispersity index (PDI).
The second method of DLS analysis (regularization analysis) draws upon a library of DLS data to recreate the measured correlation function and determine a distribution of sizes within a sample (Figure 3). Both of these analysis methods follow the latest ISO standards for particle size analysis by DLS as stated within ISO 22412:2017.
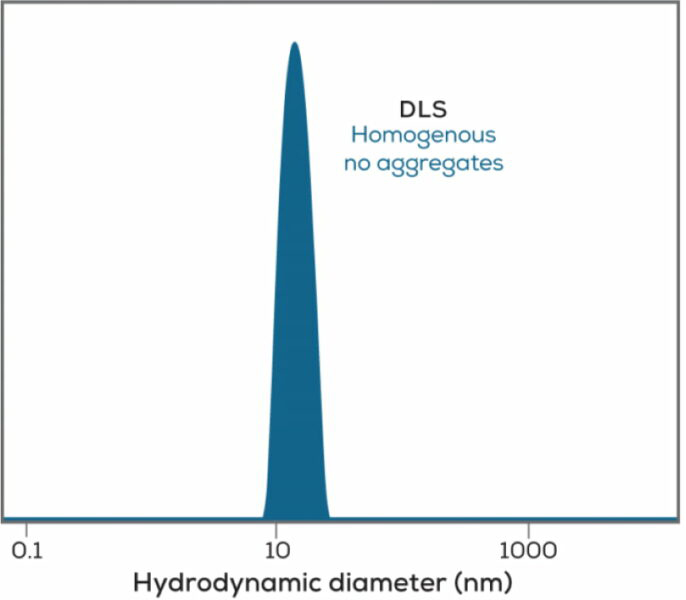
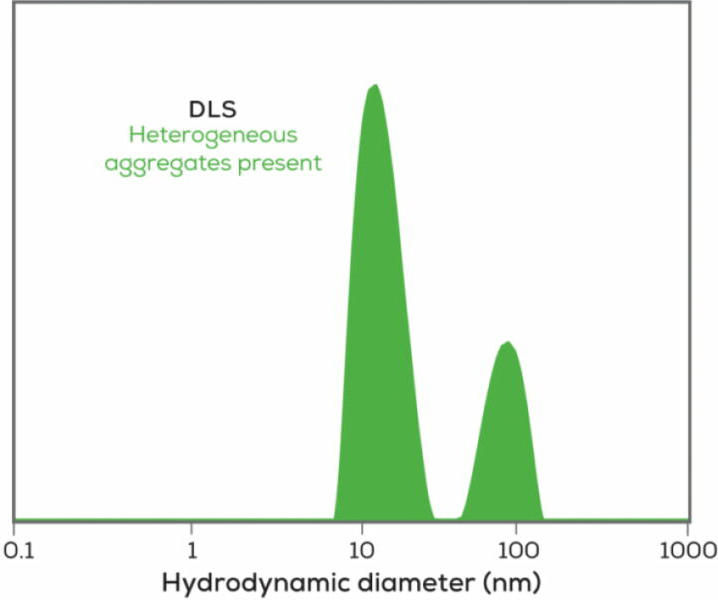
In the world of biologics, dynamic light scattering will not only tell you the size of your sample, it is also a quick check to determine if your sample is aggregated. Since large particles scatter light intensely (scattering increases with the sixth power of the size), DLS can detect even very rare aggregates in a sample. Sending up a warning flag on protein aggregates can save you from relying on data from a sample already past its prime, or help explain why your antibody is no longer performing at its peak.
All Unchained Labs dynamic light scattering instruments deliver:
- Accurate, repeatable, and reproducible sizing data in less than a minute per sample
- Data using the optimal combination of small sample volumes and low concentrations
- Average diameter results for whole samples
- Size distributions when multiple peaks are found
- Highly sensitive detection of aggregates, even ones too large or too rare for traditional SEC analysis
- Size measurements from 0.3 – 1000 nm
- Measurements down to 0.1 mg/mL for lysozyme, or lower concentrations for larger proteins
Check out our dls instrument line-up, designed to solve biologics problems.
Stunner
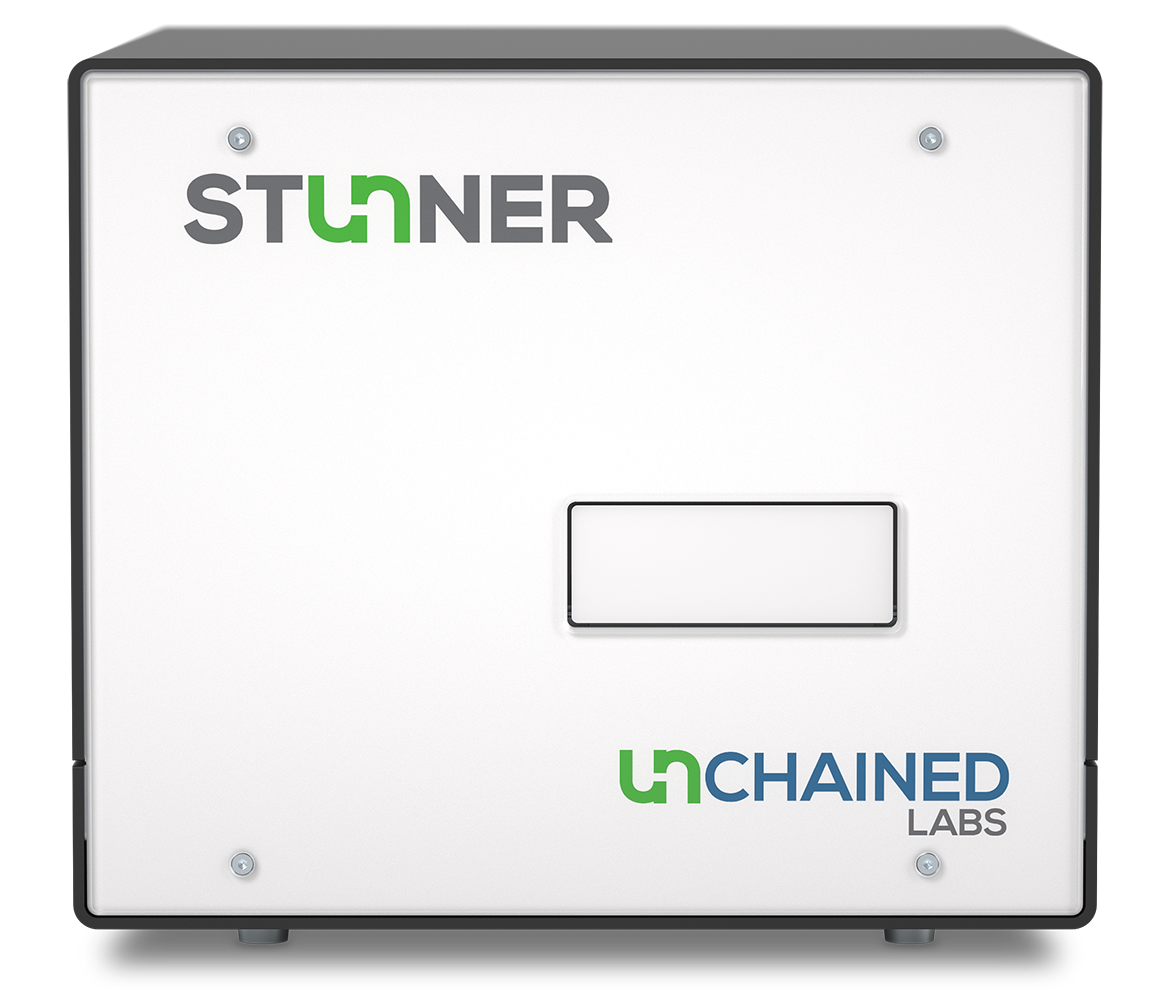
Stunner is the only system out there that takes UV/Vis concentration and rotating angle dynamic light scattering measurements from the same sample in the same run. Pairing up these techniques checks concentration, hydrodynamic size, polydispersity, and detection of aggregates off your to-do list in one shot – using only 2 µL of sample. And concentration measurements are spot-on with accuracy within 2% and precision within 1%.
UV/Vis and DLS analysis also combine to uniquely measure colloidal stability of your samples with kD or B22 data. Instead of making assumptions, Stunner takes an accurate read on concentration for every data point and combines that with DLS data to show how your protein is interacting with itself in solution.

Aunty
Aunty combines fluorescence, static light scattering, and dynamic light scattering measurements of samples in quartz 96-well plates to deliver results for all protein stability questions like unfolding and aggregation. Static light scattering will tell you when your aggregates form with unmatched sensitivity and dynamic light scattering will report their size – in Aunty you’ve got a flexible tool that is ready to answer any protein stability question with unrivalled speed and data quality. Seeing the whole story on when proteins unfold and aggregate reveals exactly what’s going on with protein samples – over time or in a thermal gradient. Aunty also provides insights into long term stability or colloidal stability (B22, kD and G22), making it the queen of protein stability.
FAQs
Ready for more?
Biologics researchers can now find the right tool built for biologics problems across two dynamic light scattering instruments. Have a question or can’t wait to find out more?


